The wider market
Where the market's headed
Direction is read province-wide. A single city swings too much month to month to trend reliably — a handful of unusual sales can move its numbers several percent with nothing having actually changed.
Ontario · All home types · SEP 2026
Buyer's market, steady
Looser than a normal Sep, and holding roughly where it was a year ago.
Benchmark price
-1.7%
Months of Inventory
5.4
Inventory vs Last year
+4.0%
Southern Ontario Market Holds Steady as Buyers and Sellers Adjust
Southern Ontario’s housing market moved at a steadier pace in September. Fewer homes changed hands than a year ago, but sellers also listed more selectively, which kept the market from tipping too far in either direction. With prices easing gently rather than falling sharply, the fall season offers real opportunities on both sides of the table.
-
Supply
Fewer new listings came to market this month, though buyers still have a healthy selection to choose from.
-
Prices
Prices have softened modestly from last year, giving buyers more breathing room while well-priced homes continue to attract interest.
-
Buyers
Buyers can take their time and compare options, and sellers who price thoughtfully are still finding motivated purchasers.
-
Condos
Condos remain the most price-sensitive segment, which creates an opening for first-time buyers and investors.
-
Rates
The Bank of Canada is holding steady, though fixed mortgage rates have edged up slightly.
Since 2006
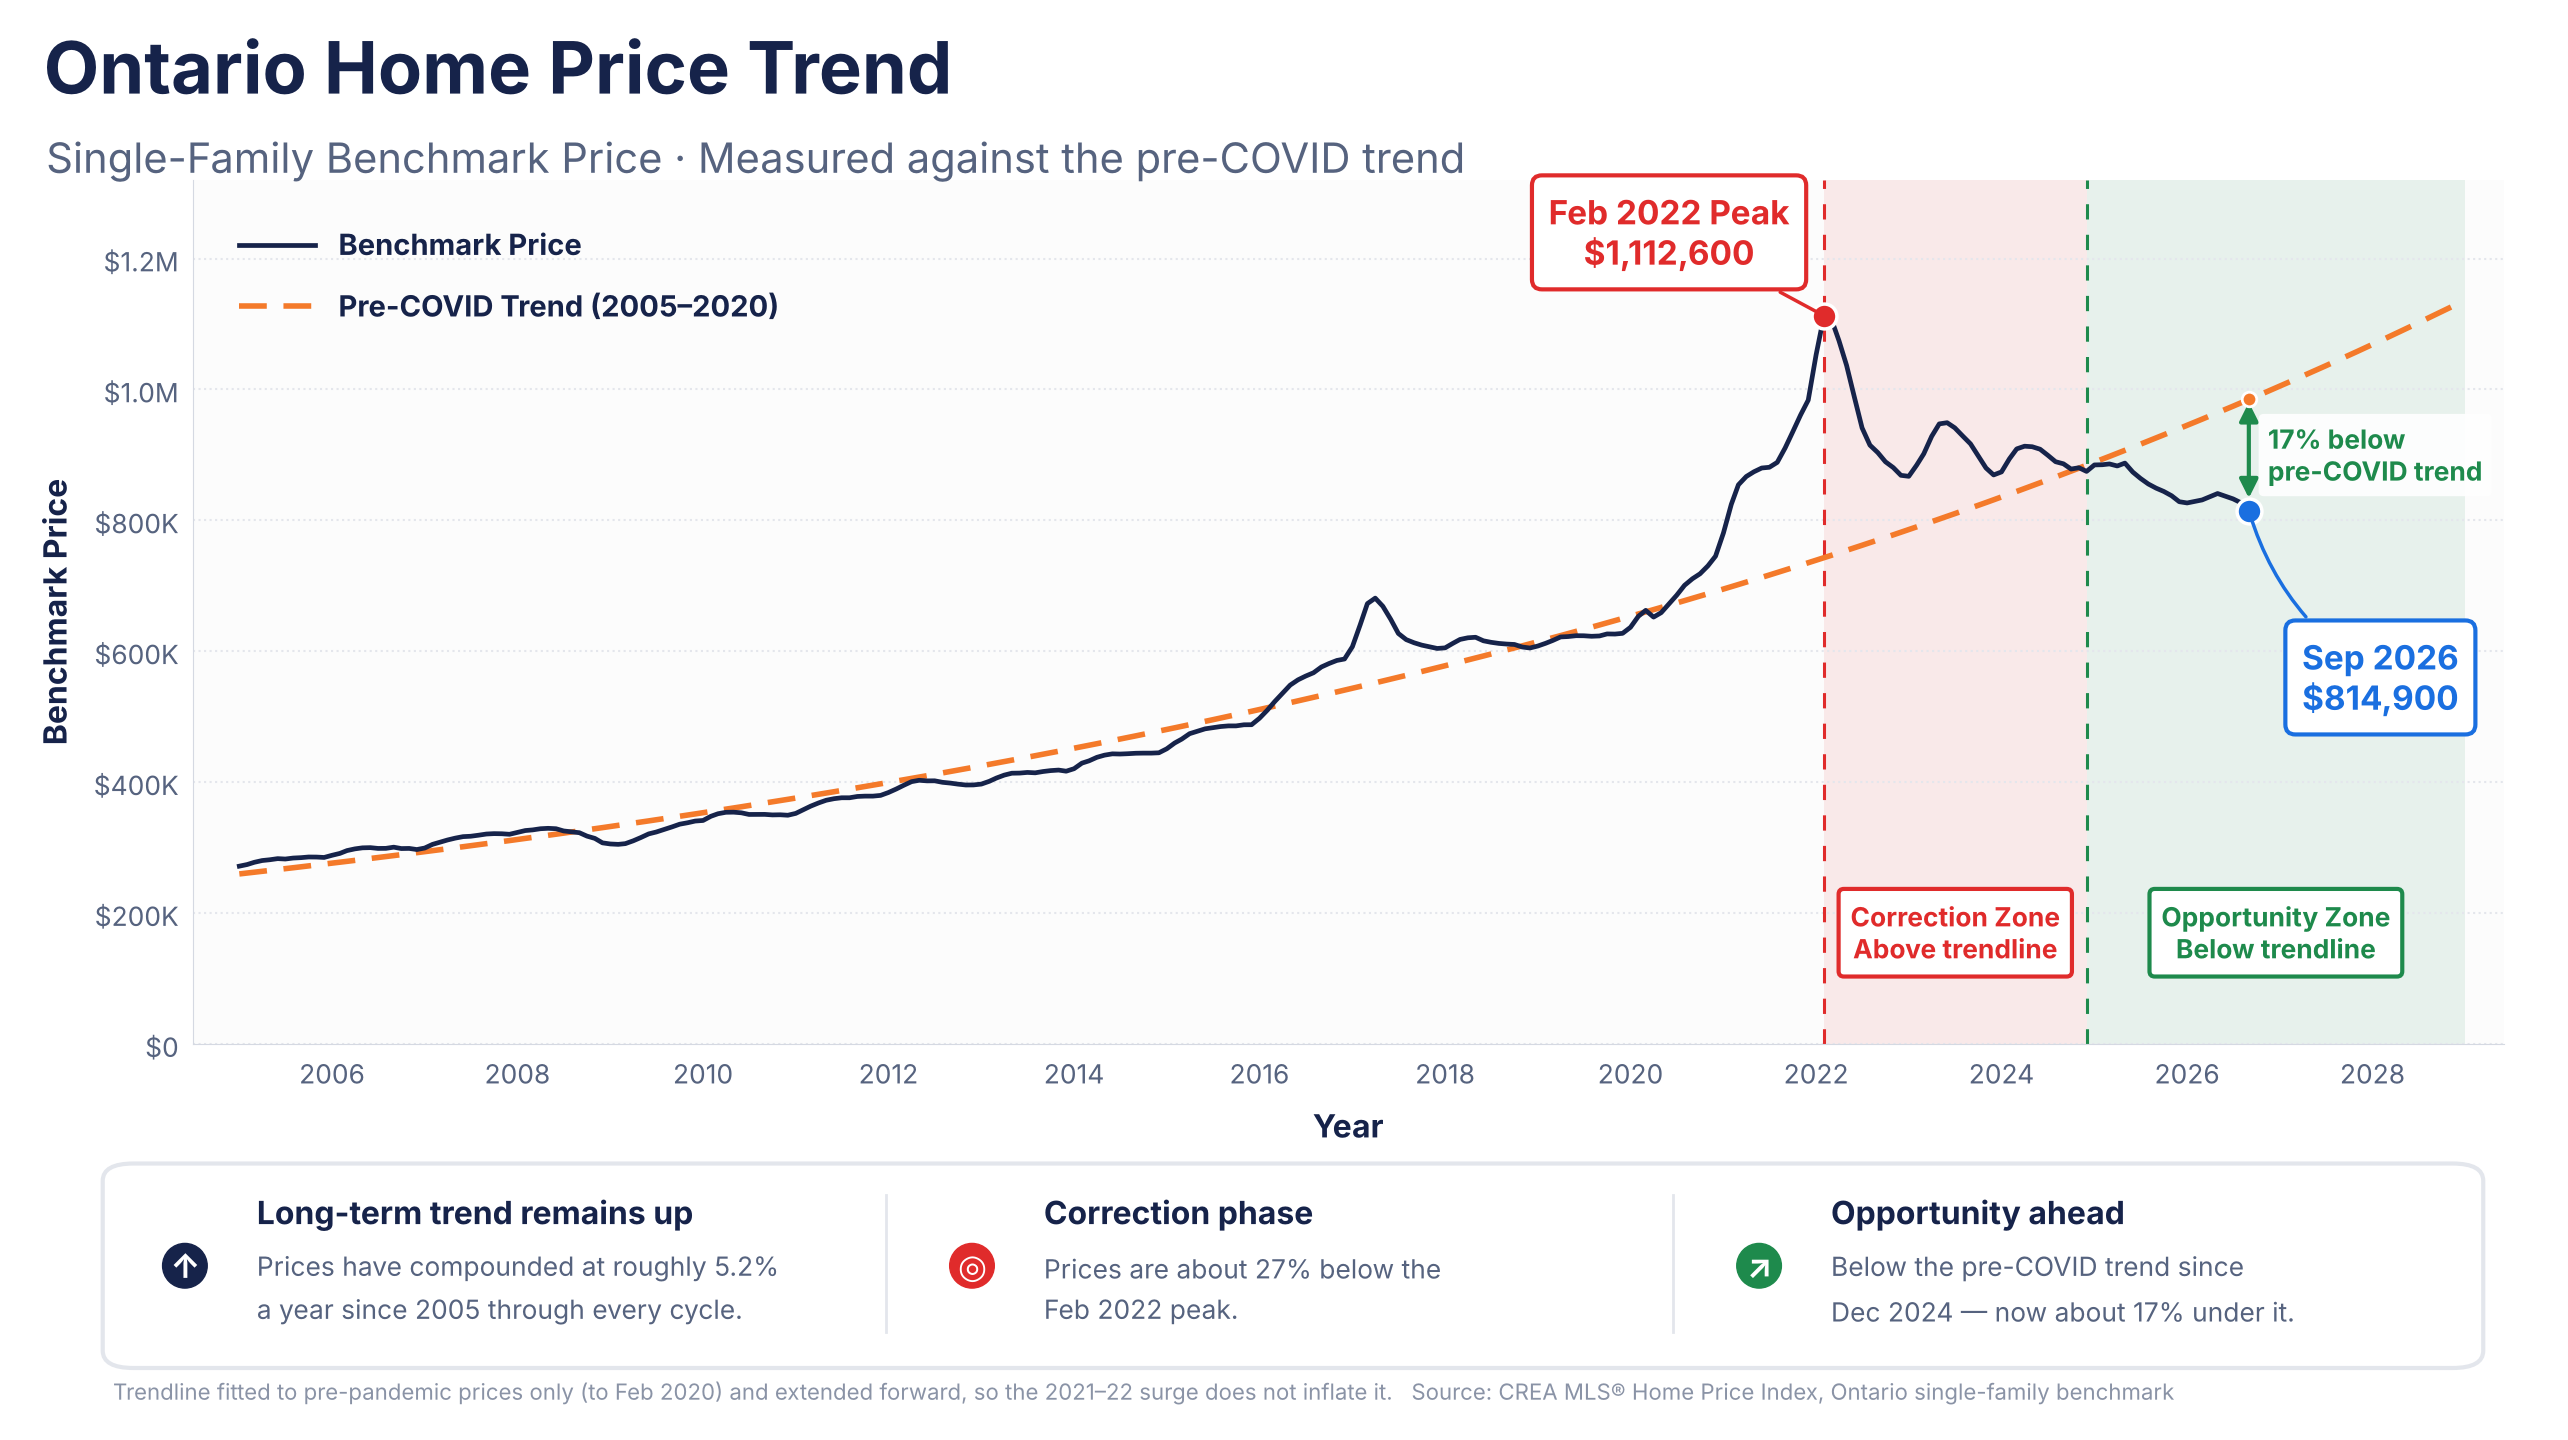
The long view
Prices have eased about 27% from the February 2022 peak and now sit below the pre-COVID trend. Over the long run, that trendline still points steadily upward.
Disclaimer: This chart is for informational purposes only and is not financial, investment, or real estate advice. The trendline is fitted to pre-COVID prices (January 2005 to February 2020) and extended forward. It shows how the market has behaved historically and is not a forecast. A price below the trendline compares today’s value with that historical pattern; it does not mean prices have bottomed. Many economic, demographic, and policy factors affect home values, so actual results may differ, and individual properties, neighbourhoods, and home types can perform differently from the overall market. Data source: CREA (Canadian Real Estate Association) MLS® Home Price Index, Ontario single-family benchmark price, January 2005 to September 2026.
The numbers behind it
Market factors
The commentary above reads these. Here they are on their own.
Bank of Canada Rate
2.25%
Held since last year · next decision Oct 28
5-Year Fixed
4.34%
Up about 0.10 pp since September as bond yields rose
5-Year Variable
3.40%
Steady, with prime unchanged at 4.45%
Ontario Unemployment Rate
7.1%
Up 0.1 pp from August, down 0.9 pp from a year ago
Housing Starts
229,000 units
National annual pace, little changed in August
Real GDP growth
3.3%
Annualized in Q2, ahead of the Bank of Canada’s 2.5% forecast
Your local market
Detached homes in Brampton
Everything for your own city and property type, in one place.
Benchmark price
$1.16M
Days to sell
24
Months of supply
4.3
Mississauga Detached
12-month rolling
Year over year
Month over month
Year Prior
Current
New listings and sales
Demand supply, 13-month rolling
For sale
Sold
New
See Brampton's monthly data
Period
New
Active
Sold
Months
Both charts are smoothed. A single month in one city moves too much to read on its own — the rolling view shows the shape without the noise.
Past 12 months
How your city compares
Market Performance by Region (Past 12 months. Median Price of Detached Home)
What this means for you
Three ways to read this
If you're selling
Fewer new listings came to market this month, so well-presented homes stand out. Buyers still have choice, which means pricing to today’s market rather than past highs is what brings serious offers.
What would mine sell for? →If you're buying
Prices have eased and there’s a healthy selection to choose from, so you can take your time and compare. Keep an eye on fixed mortgage rates, as they’ve edged up slightly.
See what I can afford →If you're holding
Nothing here calls for a quick decision. It’s still worth knowing where your equity stands, especially if your mortgage renews in the next couple of years.
Check my equity →
Request report
Is now the right time
Is now the right time
to make your move?
This page shows the market. A full report shows your home in it — what it would realistically sell for today, and where your equity takes you next. No pressure, just a real conversation when you're ready.
Top Home Search App
Real-time MLS® listings across Ontario — sold comparables, school scores, neighbourhood insights and commute times. Save favourites, get instant alerts, and message me anytime to book a showing.